
Home
Background
Interpretation
Manx Projects
Y-STR analysis
Introduction
FTDNA automatically generates a list of "matches" between your Y-STR test result with all other test profiles they have (subject to neither party opting out). This is a useful facility, but it is far from infallible. Genealogically interesting matches can be missed (due to failing to meet the FTDNA threshold), whilst published matches can result from very distant genetic relationships. These problems are particularly acute when only a small number of markers are compared. (The comparisons are done separately for each of the Y12, Y25, Y37, Y67 and Y111 sets of markers which both profiles have had tested.)
FTDNA also hosts many thousands of public Y-DNA projects, and through these it is practical to manually find matches, and also to conduct a much more detailed analysis. The two projects which are of particular use (if they exist) are those for the surname and haplogroup corresponding to the test profile. The surname project should capture those samples which are expected to be genealogically and genetically closest. Haplogroup projects are typically larger and includes those with a genetic relationship due to the sharing of a common patrilineal ancestor (typically) thousands of years ago.
Y-STR test This page will discuss two aspects of Y-STR analysis. Firstly it will consider how any two Y-STR test results are compared to test for a relationship, and how to interpret the output of that comparison. Secondly it discusses how a collection of Y-STR results from putatively related individuals can be used to better understand the relationships between them.
The examples in this section used the smallest set of FTDNA markers (Y12) for simplicity. In practice however it is always best to use the maximum number of shared markers for comparisons.
Comparing two Y-STR profiles
If two individuals are closely related then their Y-STR profiles will be similar or identical to that of their common patrilineal ancestor. This is turn means that the two profiles will be close, with any differences due to mutations in one or other descent from their common ancestor. By analysing the differences between two profiles, we can estimate the number of generations separating them. Such an estimate is used to determine official "matches".
&n bsp;
The simplest way of estimating the number of mutations separating two Y-STR profiles is to count the number of pairs of values which differ. A slightly more sophisticated way is to measure this "genetic distance" by summing the absolute differences between all of the pairs of values. This is because mutations typically only change a value by 1, and the refined calculation captures multiple mutations of the same Y-STR marker.
| Marker | DYS393 | DYS390 | DYS19 | DYS391 | DYS385 | DYS426 | DYS388 | DYS439 | DYS389I | DYS392 | DYS389II |
| Profile 1 | 13 | 25 | 15 | 11 | 11-17 | 11 | 13 | 11 | 14 | 11 | 30 |
| Profile 2 | 13 | 24 | 15 | 11 | 11-15 | 11 | 13 | 11 | 14 | 11 | 30 |
In the above example, there are 2 differences between the profiles (in DYS390 and DYS385), but a genetic difference of 3. This gives an estimate of 3 mutations separation.
To convert the genetic distance into a measure of how closely related the two individuals are, we need to divide by the value in the table below. (The justification for this approach is provided in the Y-STR statistics section.)
| Y12 | Y25 | Y37 | Y67 | Y111 |
| 0.023 | 0.050 | 0.120 | 0.154 | 0.261 |
Since we are here comparing the sets of Y12 markers, we divide here by 0.023 and obtain the estimate of 3/0.023 = 130 generations of separation. That indicates that both testers had a common ancestor about 65 generations ago. This is too distant a relationship to be genealogically useful. If we were comparing Y111 profiles however then a genetic difference of 3 would give an estimate of 3/0.261 or about 11.5 generations of separation, consistent with the testers being fifth cousins.
Combining multiple Y-STR profiles
If we have more than two related profiles then we can start to obtain a more detailed understanding. The following ficticious example shows this.
| Marker | DYS393 | DYS390 | DYS19 | DYS391 | DYS385 | DYS426 | DYS388 | DYS439 | DYS389I | DYS392 | DYS389II |
| Profile 1 | 13 | 25 | 15 | 11 | 11-17 | 11 | 13 | 11 | 14 | 11 | 30 |
| Profile 2 | 13 | 24 | 15 | 11 | 11-15 | 11 | 13 | 11 | 14 | 11 | 30 |
| Profile 3 | 13 | 24 | 14 | 11 | 11-15 | 11 | 13 | 11 | 14 | 11 | 30 |
| Profile 4 | 13 | 24 | 15 | 11 | 11-15 | 11 | 13 | 11 | 14 | 11 | 31 |
| Profile 5 | 13 | 25 | 15 | 11 | 11-16 | 11 | 13 | 11 | 14 | 11 | 30 |
One way of representing the relationships between these five individuals is in the diagram below. Here "Source" denotes the most recent common ancestor of all five testers, and the circles represent mutations which have occurred in each line of descent.
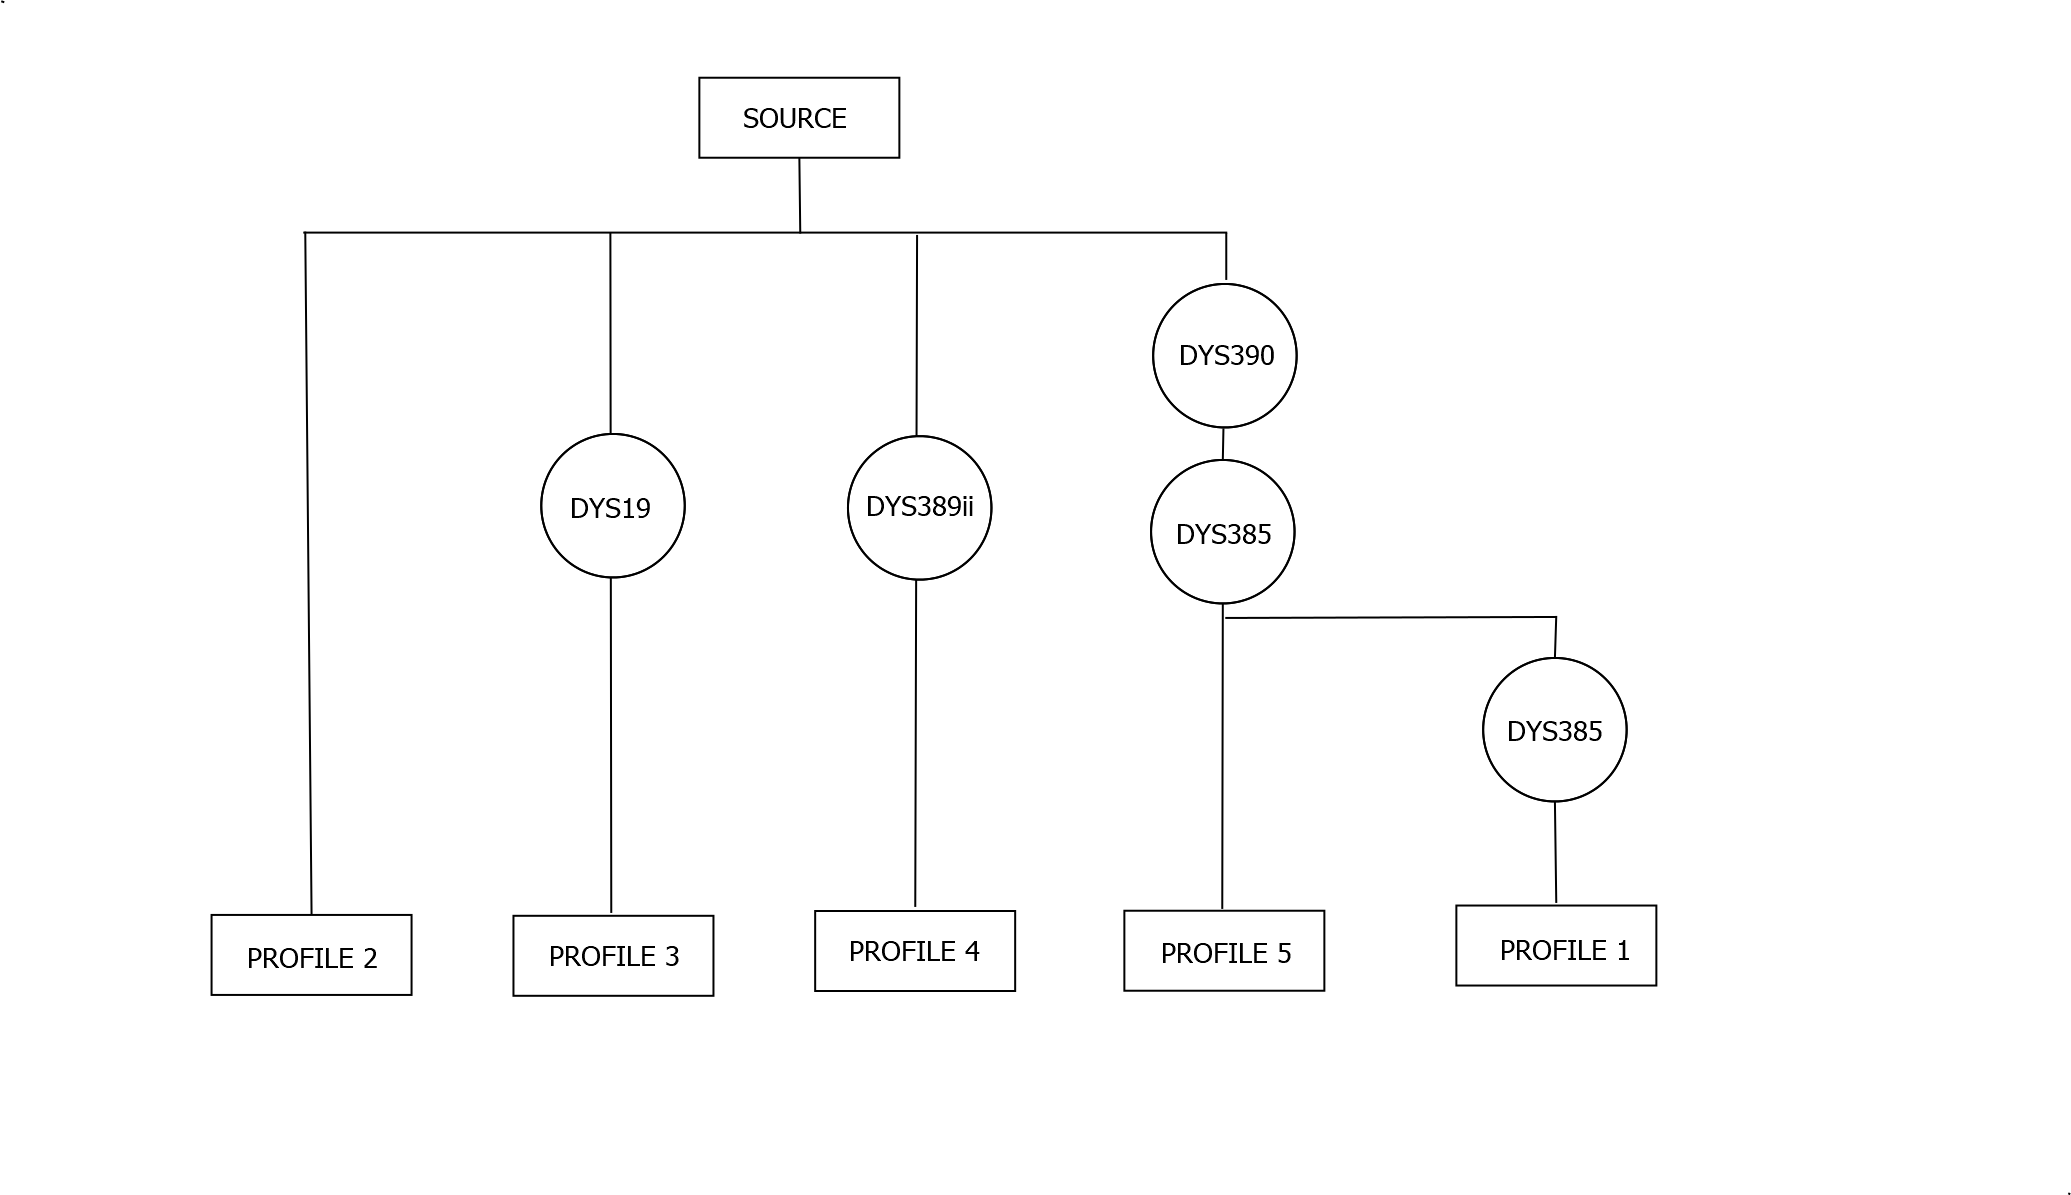
This isn't the only possibility however. It is possible for example that Profiles 2,3 and 4 are all descended from the same descendant of the Source, and that the first DYS385 mutation occurred between the Source and this descendant.
The most powerful results come from combining genealogical and genetic information. As more Y-DNA tests are done, and with more detailed tests, it becomes possible to match Y-DNA profiles much more precisely to specfic family tree branches. As an example, when considering Y111 markers, there is roughly a one in four chance of a mutation which could ultimately enable us to distinguish between a descent from a particular man any of his brothers. This probability increases to at least one half if the BIG-700 test is available (incorporating Y-SNP results).